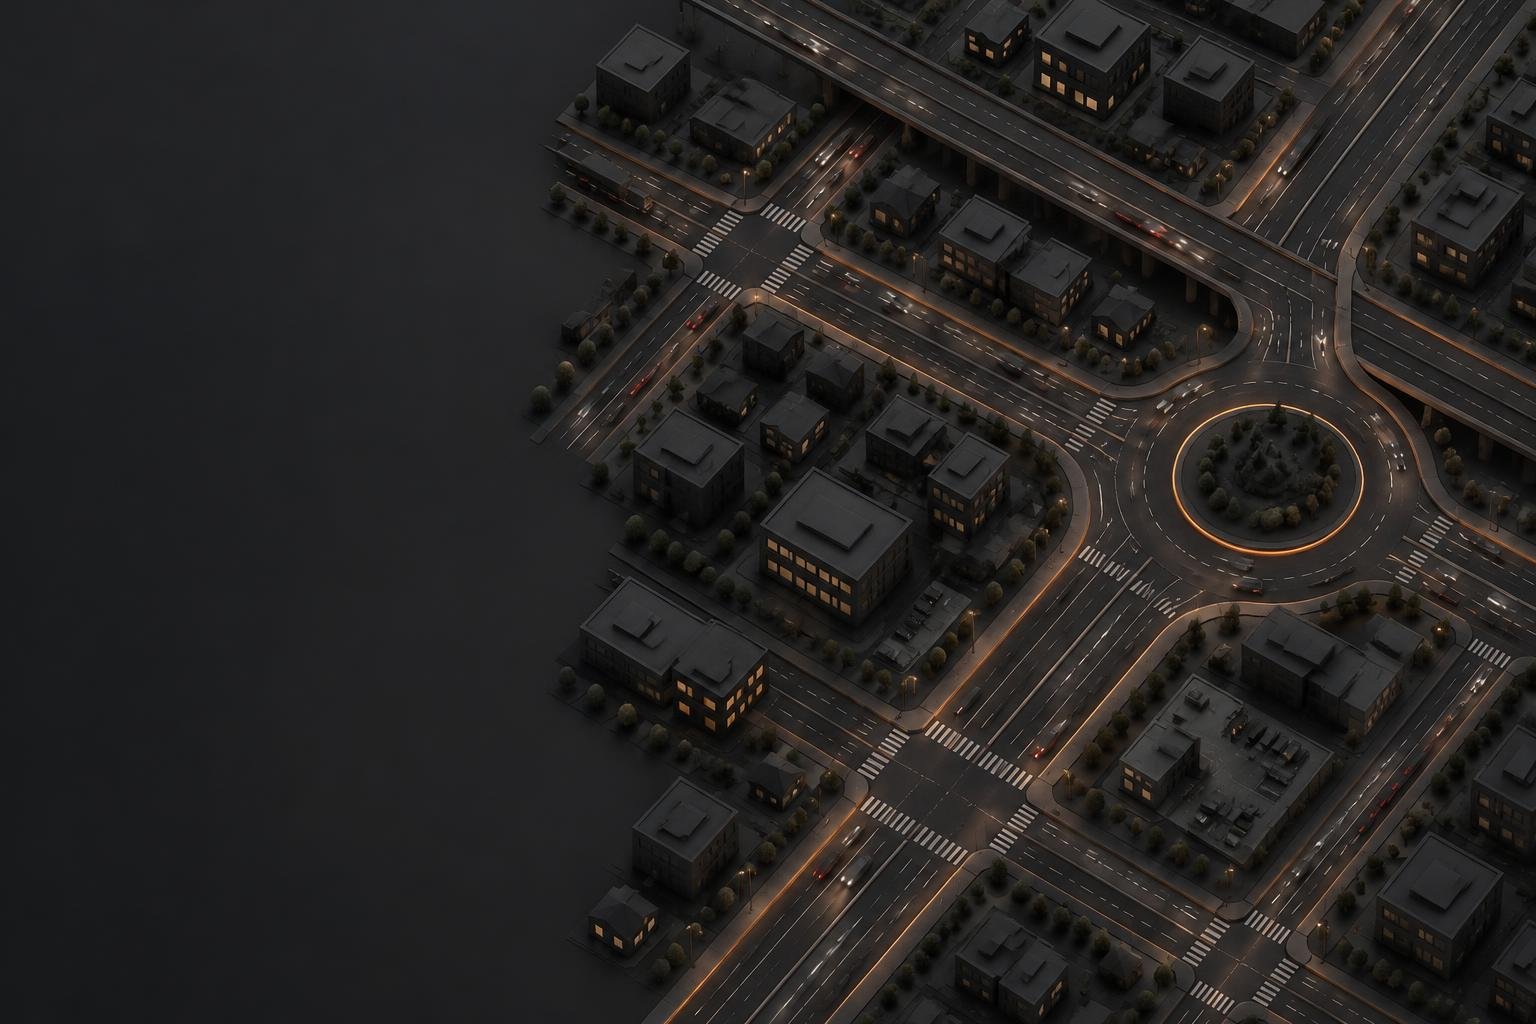
FOR CONSULTANCIES
Get to a defensible shortlist faster on fixed-fee and bid work.
Test it in a twin.
Model a junction, run the interventions you’re considering, and compare them before committing to a design.
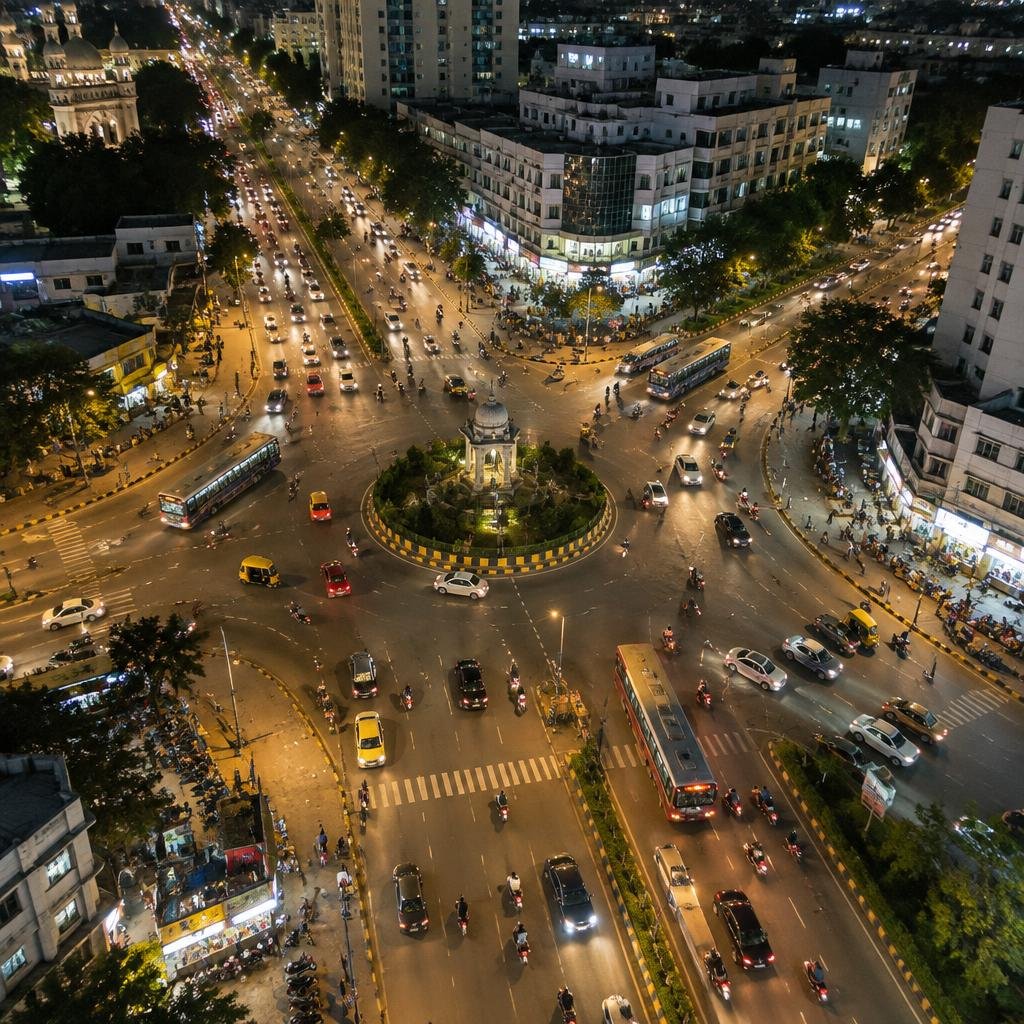
Now demonstrating at YMCA Circle, Narayanaguda, Hyderabad.
Bring the options, assumptions, and trade-offs into the same conversation — before a design becomes a commitment.
Get to a defensible shortlist faster on fixed-fee and bid work.
Compare interventions with assumptions you can review before committing public resources.
Follow why an option was chosen, without a modeller in the room.
How it works
See how the junction behaves today, and where queues and delays build.
Run the changes you’re considering and estimate how traffic responds.
Compare options side by side, with every assumption visible.
Under the hood
Terascope runs a traffic simulation of the junction. AI does two specific jobs that turn real-world traffic data into a model you can test options on.
Traffic data from [DATA SOURCE NAME]
Speeds, travel times and movement patterns from connected vehicles and devicesEstimates traffic volumes from sampled probe data
Calibrates the simulation to observed speeds and travel times
Calibrated simulation, built on [SIMULATOR]
Scenario results and comparisons
Probe data shows a sample of vehicles, not every vehicle. AI estimates full traffic volumes and turning movements from that sample.
The simulation is tuned automatically until its speeds and travel times match the observed data, a step that typically takes [X days] by hand.
Every scenario result comes from the calibrated simulation. We test it against time periods and measurements it wasn’t tuned on.
Request the validation noteYMCA Circle, Narayanaguda, Hyderabad.
A baseline and three intervention options, compared side by side.
| Scenario | Delay / vehicle | Queue length | Travel time | Throughput |
|---|---|---|---|---|
| Baseline | [X] | [X] | [X] | [X] |
| Signal timing | ↓ [X] | ↓ [X] | ↓ [X] | ↑ [X] |
| Turn restriction | ↓ [X] | ↑ [X] | ↓ [X] | ↑ [X] |
| Geometry change | ↓ [X] | ↓ [X] | ↓ [X] | ↑ [X] |
[X] = placeholder. Arrows illustrate how comparisons will be presented; they are not measured results. Blue: better · Amber: worse.
The model is only as useful as the evidence behind it. Keep the scope, data, and limits visible.
Estimated volumes vs manual counts on a sample: [X%].
Simulated vs observed speeds and travel times: [fit result].
Results on time periods not used in calibration: [result].
Probe data under-represents vehicles without connected devices, such as many two-wheelers and autos. [How we account for this]. Not yet tested: special events, monsoon disruption, incidents, other junctions.
Accuracy is assessed against observed conditions within the agreed modelled area. Calibration and fit: [placeholder]. No accuracy claim is made until the validation evidence is available.
Data sources for the YMCA Circle demonstration: [placeholder]. The validation note will identify the observations, dates, coverage, and assumptions used.
Terascope runs a traffic simulation of the junction, built on [SIMULATOR], using traffic data from [DATA SOURCE NAME]. AI does two jobs. First, it estimates full traffic volumes and turning movements from sampled probe data. Second, it automatically calibrates the simulation so its speeds and travel times match what was observed, a step that typically takes [X days] by hand. We then test the calibrated model on time periods it wasn’t tuned on. Every scenario result comes from that calibrated simulation, and the full validation note is available on request.
We use [DATA SOURCE NAME]: anonymised, aggregated speed and travel-time data from connected vehicles and devices. It contains no personal information. [Note on supplementing with manual counts where needed].
Not fully: they are less likely to carry connected devices than cars. [How Terascope accounts for this, e.g. calibration against a short manual count at each junction].
No. Terascope sits at the options stage. Your simulation tool remains part of detailed design and any further analysis required.
The final recommendation remains with the responsible project team. Terascope supports comparison; it does not take responsibility for a design decision.

Test it in a twin. Build it in the city.
Tell us what you’re working on, and what you need to understand before moving forward.